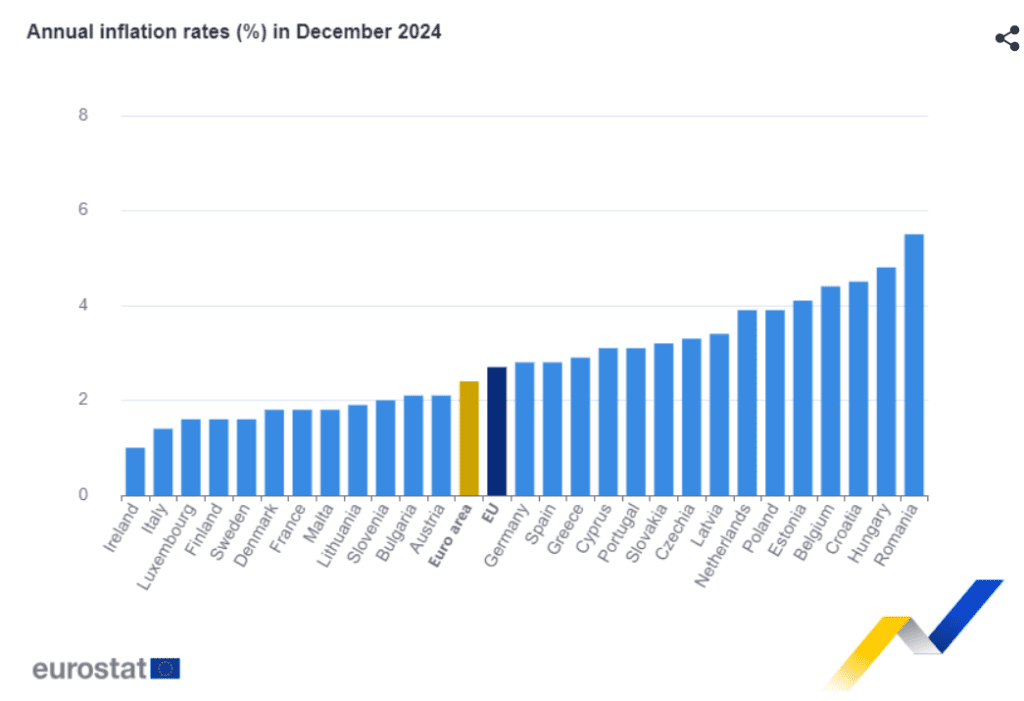
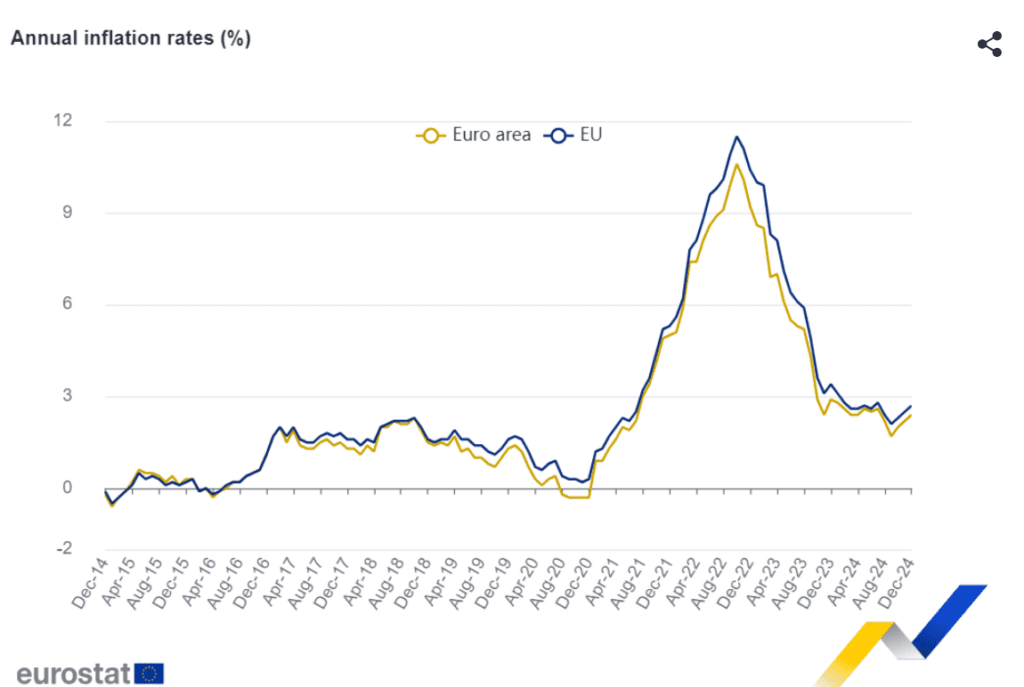
The annual inflation rate in the euro area reached 2.4 % in December 2024, up from 2.2 % in November. A year earlier, it was 2.9 %. In the European Union, annual inflation was 2.7 % in December 2024, up from 2.5 % in November. A year earlier, it was 3.4 %. These figures are published by Eurostat, the statistical office of the European Union.
The lowest annual inflation rates were recorded in Ireland (1.0 %), Italy (1.4 %), Luxembourg, Finland and Sweden (all 1.6 %). The highest annual rates were recorded in Romania (5.5 %), Hungary (4.8 %) and Croatia (4.5 %). Compared to November 2024, annual inflation fell in seven Member States, remained stable in one and increased in 19.
In December 2024, services (+1.78 percentage points, pp), followed by food, alcohol and tobacco (+0.51 pp), non-energy industrial goods (+0.13 pp) and energy (+0.01 pp) were the main contributors to the annual inflation rate in the euro area.
Inflation rate (%) measured by HICP
| Roční míra | Měsíční míra | |||||||
| 12/23 | 7/24 | 8/24 | 9/24 | 10/24 | 11/24 | 12/24 | 12/24 | |
| Eurozone | 2.9 | 2.6 | 2.2 | 1.7 | 2.0 | 2.2 | 2.4 | 0.4 |
| EU | 3.4 | 2.8 | 2.4 | 2.1 | 2.3 | 2.5 | 2.7 | 0.3 |
| Belgium | 0.5 | 5.4 | 4.3 | 4.3 | 4.5 | 4.8 | 4.4 | 0.7 |
| Bulgaria | 5.0 | 2.8 | 2.4 | 1.5 | 2.0 | 2.0 | 2.1 | 0.3 |
| ČR | 7.6 | 2.5 | 2.4 | 2.8 | 3.0 | 3.1 | 3.3 | -0.3 |
| Denmark | 0.4 | 1.0 | 1.4 | 1.2 | 1.6 | 1.6 | 1.8 | -0.3 |
| Germany | 3.8 | 2.6 | 2.0 | 1.8 | 2.4 | 2.4 | 2.8 | 0.7 |
| Estonia | 4.3 | 3.5 | 3.4 | 3.2 | 4.5 | 3.8 | 4.1 | 0.3 |
| Ireland | 3.2 | 1.5 | 1.1 | 0.0 | 0.1 | 0.5 | 1.0 | 0.9 |
| Greece | 3.7 | 3.0 | 3.2 | 3.1 | 3.1 | 3.0 | 2.9 | 0.1 |
| Spain | 3.3 | 2.9 | 2.4 | 1.7 | 1.8 | 2.4 | 2.8 | 0.4 |
| France | 4.1 | 2.7 | 2.2 | 1.4 | 1.6 | 1.7 | 1.8 | 0.2 |
| Croatia | 5.4 | 3.3 | 3.0 | 3.1 | 3.6 | 4.0 | 4.5 | 0.2 |
| Italy | 0.5 | 1.6 | 1.2 | 0.7 | 1.0 | 1.5 | 1.4 | 0.1 |
| Cyprus | 1.9 | 2.4 | 2.2 | 1.6 | 1.6 | 2.2 | 3.1 | -0.3 |
| Latvia | 0.9 | 0.8 | 0.9 | 1.6 | 2.1 | 2.3 | 3.4 | 0.3 |
| Lithuania | 1.6 | 1.1 | 0.8 | 0.4 | 0.1 | 1.1 | 1.9 | 0.2 |
| Luxembourg | 3.2 | 2.7 | 1.7 | 0.8 | 0.9 | 1.1 | 1.6 | 0.1 |
| Hungary | 5.5 | 4.1 | 3.4 | 3.0 | 3.4 | 3.9 | 4.8 | 0.5 |
| Malta | 3.7 | 2.3 | 2.4 | 2.1 | 2.4 | 2.1 | 1.8 | -0.4 |
| Netherlands | 1.0 | 3.5 | 3.3 | 3.3 | 3.3 | 3.8 | 3.9 | 0.3 |
| Austria | 5.7 | 2.9 | 2.4 | 1.8 | 1.8 | 1.9 | 2.1 | 0.7 |
| Poland | 6.2 | 4.0 | 4.0 | 4.2 | 4.2 | 3.9 | 3.9 | 0.1 |
| Portugal | 1.9 | 2.7 | 1.8 | 2.6 | 2.6 | 2.7 | 3.1 | -0.3 |
| Romania | 7.0 | 5.8 | 5.3 | 4.8 | 5.0 | 5.4 | 5.5 | 0.3 |
| Slovenia | 3.8 | 1.4 | 1.1 | 0.7 | 0.0 | 1.6 | 2.0 | -0.1 |
| Slovakia | 6.6 | 3.0 | 3.2 | 2.9 | 3.5 | 3.6 | 3.2 | -0.5 |
| X | X | X | X | X | X | X | X | X |
| Finland | 1.3 | 0.5 | 1.1 | 1.0 | 1.5 | 1.7 | 1.6 | 0.1 |
| Sweden | 1.9 | 1.7 | 1.3 | 1.2 | 1.6 | 2.0 | 1.6 | 0.3 |
| Island | 6.9 | 5.1 | 4.3 | 3.4 | 3.8 | 3.5 | 3.6 | 0.3 |
| Norway | 4.7 | 2.4 | 2.3 | 2.7 | 2.2 | 1.9 | 1.7 | -0.1 |
| Switzerland | 2.1 | 1.2 | 1.0 | 0.9 | 0.7 | 0.7 | 0.4 | -0.1 |
Eurostat/ gnews.cz - RoZ
ILLUSTRATIVE PHOTO - pixabay